
Streamlit tutorial(How to build machine learning applications)


Data science deals with large volumes of data using modern tools and methods to extract hidden patterns, obtain meaningful information, and inform business decisions. The application of data science in business, education, and economics has led to the emergence of various tools.
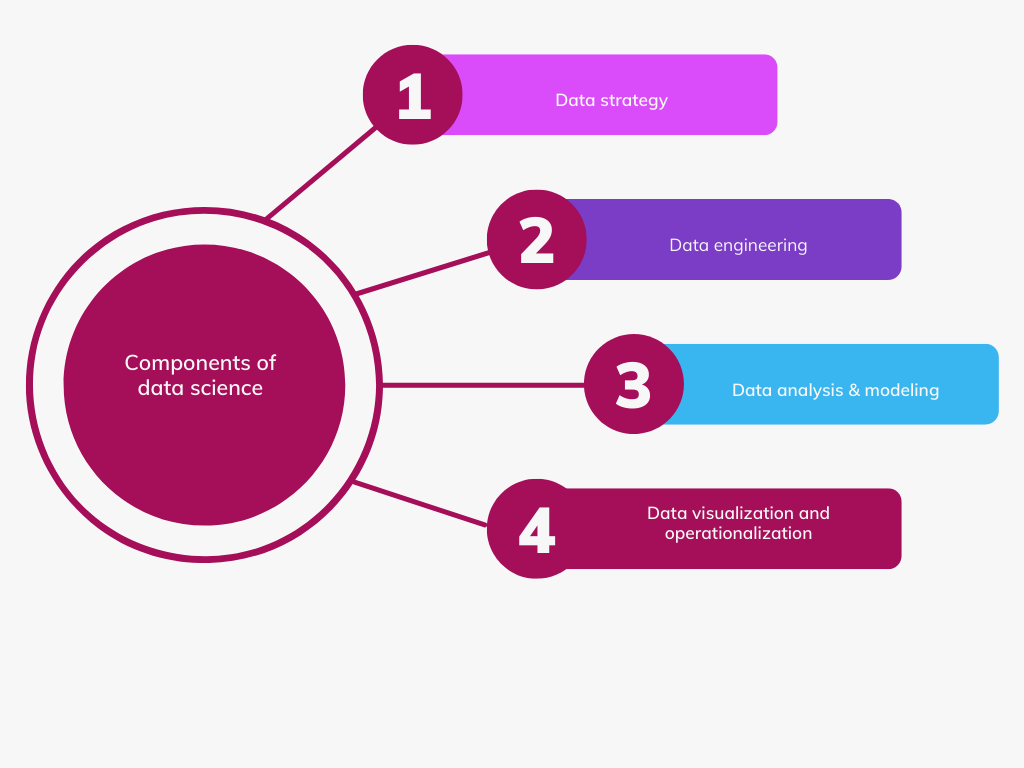
Applying data science requires understanding the main components of a data science product, including data strategy, engineering, analysis & modeling, and visualization & operationalization.
In most data science products, analysis, modeling, and visualization are considered primary in obtaining insights for decision-making. However, one of the predominant issues data scientists face in developing data science applications is presenting the findings to the intended audience. There are various methods for showing results from data science products like data mining and machine learning. These methods include traditional desktop-based solutions (e.g., PowerPoint and HTML reports) or web apps.
This article explores how to use Streamlit to develop machine learning-based web applications.
What is Streamlit?
Streamlit is an open-source Python framework for developing web apps for machine learning and data science problems. You can instantly integrate your machine learning models with Streamlit and share them quickly as web apps. The library enables you to create an app using the same approach to writing Python code.

Complete Guide to Data Science Applications with Streamlit
Analyzing data and building machine learning models is one thing. Packaging these analyses and models such that they are sharable is a different ball game altogether.
This course aims at teaching you the fastest and easiest way to build and share data applications using Streamlit. You don't need any experience in building front-end applications for this.
Streamlit installation
Prerequisites:
Install Streamlit on Windows
On windows, using your command prompt run:
pip install streamlitTest the installation:
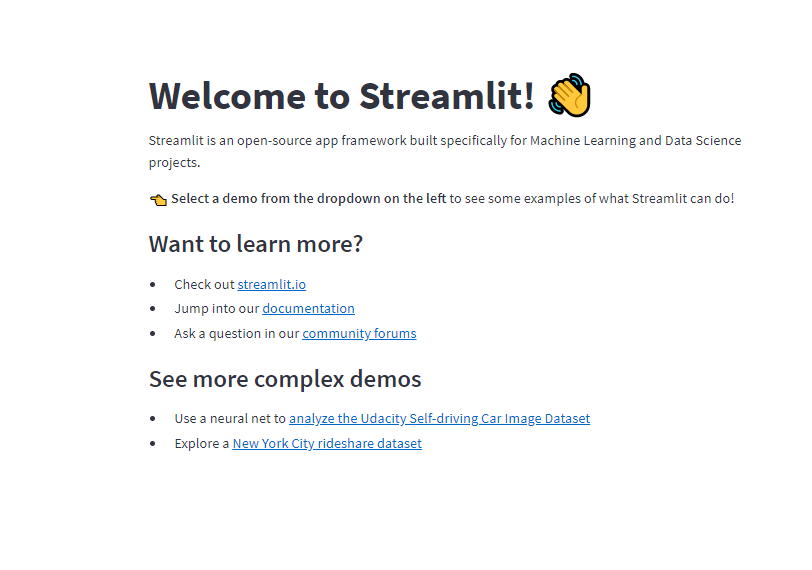
streamlit helloA web page in your default browser will be opened if the installation is successful. The following output will be displayed:
You can check Streamlit documentation by executing the following command:
streamlit docsTo upgrade your Streamlit installation to the current version:
pip install --upgrade streamlitConfirm your current version:
streamlit --versionInstall Streamlit on macOs and Linux
On macOS or Linux, Streamlit can be installed using Anaconda.
Step 1
On a macOS, run the following command :
python -m ensurepip --upgradeOn Ubuntu with Python3, the installation is done using:
sudo apt-get install python3-pipStep 2
Install virtual environment:
pip3 install pipenvFor macOS users, the following step is necessary.
Step 3
Install Xcode command line (CL) tools.
xcode-select --installThe CL tools are necessary to compile any Python dependencies during the installation of Streamlit.
Next, create the virtual environment and install Streamlit.
Create a new environment
Go to your project folder:
cd yourprojectDefine a new Pipenv environment in your project folder and activate your environment:
pipenv shellInstall Streamlit in your new environment:
pip install streamlitTest the installation:
streamlit helloUsing the new environment
Whenever you want to carry out an analysis in your new environment, you will need to navigate to your project folder (i.e., where Pipenv files are stored) and execute:
pipenv shell
Having done that, you can now use Python and Streamlit as usual.
Install Streamlit on Google Colab
If you choose Google Colab, Streamlit can be installed by executing the following code in your Colab notebook.
!pip install -q streamlitAdditional instructions for installing and using Streamlit in the official repo.


How to run Streamlit applications
Let us explore how to run Streamlit applications. Generally, there are various ways to execute Streamlit web apps, including in Google Colab, from your command prompt or Jupyter Notebook.
Run Streamlit applications on command prompt
Assuming you have created your application and saved it as a script in a file named yourfile.py, the application can be executed as shown below.
Using your command prompt:
streamlit run yourfile.pyRun Streamlit application from Jupyter Notebook
Store the application file (yourfile.py) in the exact location as the Jupyter notebook. In a cell in your notebook, run the following command:
!streamlit run yourfile.pyStreamlit widgets
A widget is embedded as an element of the host application but generally independent of the host application, having limited or no interaction with the host. It provides a way to interact with the host application.
Displaying text in Streamlit
Title
The title of a document is defined using:
st.title("Document Title")
Header
A header in Streamlit takes the format: st.header(body, anchor=None) where body is the text to display.
st.header("Article header")
Sub-header
st.header("Article subheader")
Code
st.code("y = mx + c")
Latex
st.latex("\ int a y^2 \ , dy")
Text
st.text("This is a chair!")
Markdown
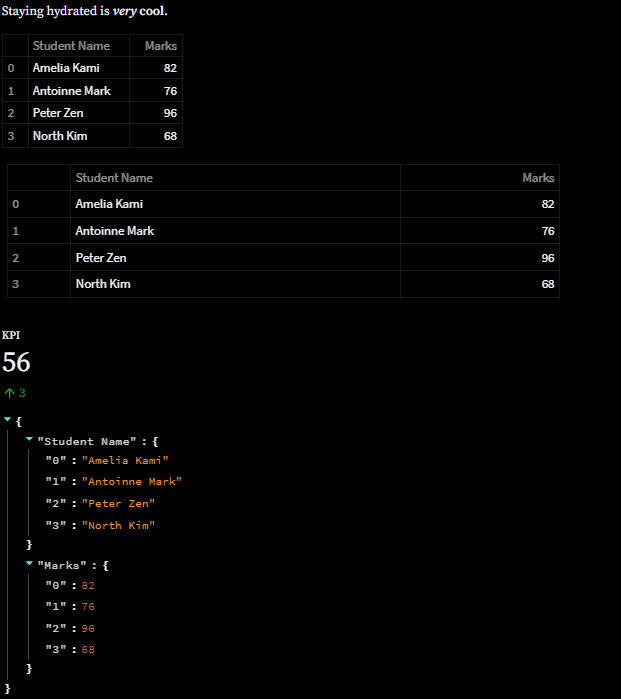
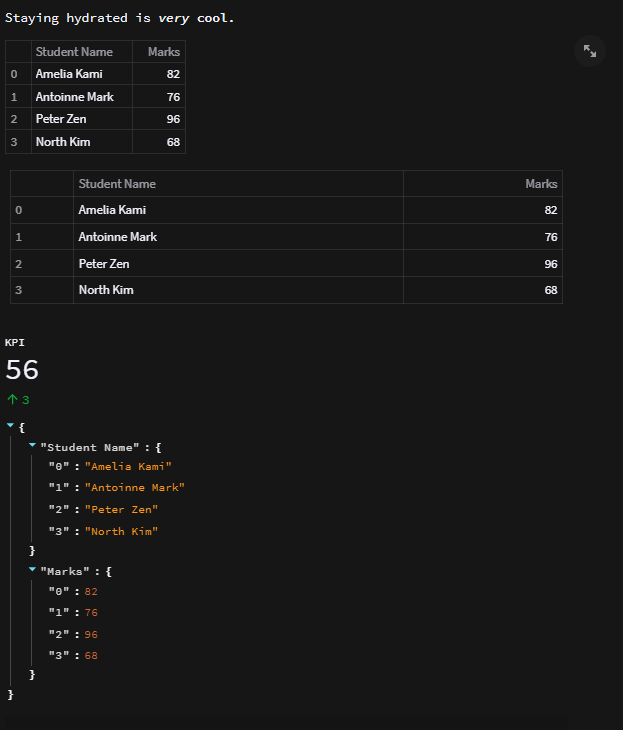
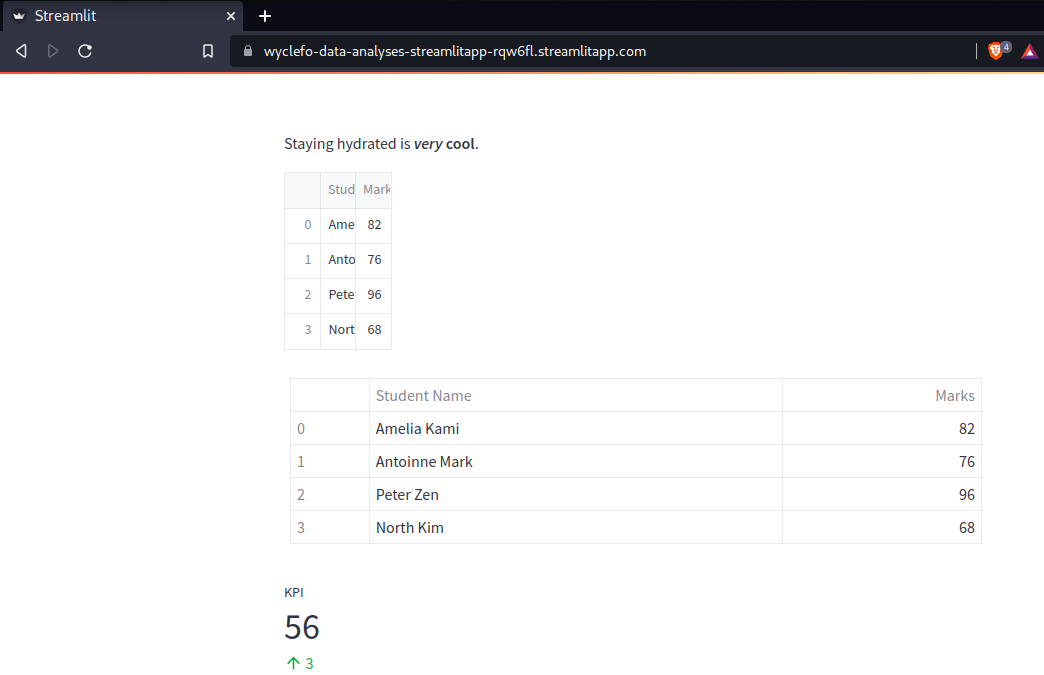
st.markdown('Staying hydrated is **_very_ cool**.')
Displaying data in Streamlit
Streamlit allows you to display data in raw, table, and chart formats using visualization tools and other methods. Raw data can be displayed using Streamlit as long as it is in the form of a Pandas DataFrame, static table, metric, Python dictionary, and JSON formats.
Dataframe
import pandas as pd
#students names
students = ["Amelia Kami", "Antoinne Mark", "Peter Zen", "North Kim"]
#marks
marks = [82, 76, 96, 68]

df = pd.DataFrame()

df["Student Name"] = students

df["Marks"] = marks
#Save to dataframe
df.to_csv("students.csv", index = False)
#display dataframe
st.dataframe(df)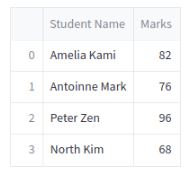
Static table
#Static table
st.table(df)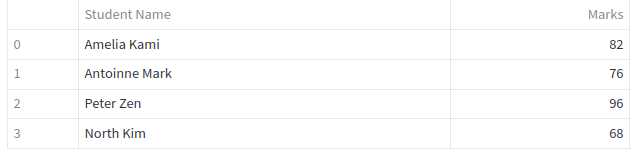
Metrics
#Metrics
st.metric("KPI", 56, 3)
JSON
#Json
st.json(df.to_dict())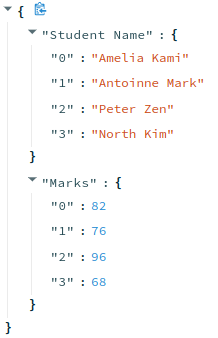
Displaying media in Streamlit
Various media elements, including audio, images, and videos, can be embedded in Streamlit apps.
#Displaying an image using Streamlit
from PIL import Image
image = Image.open('ann-unsplash.jpg')

st.image(image, caption = 'Sunset: Photo by Ann Savchenko on Unsplash')
Other elements like audio and video can be displayed using:
#Displaying video
video = open("video.mp4", "rb")
video_data = video.read()
st.video(video_data)
#Displaying mp3
audio = open("song.mp3", "rb")
audio_data = audio.read()
st.audio(audio_data)
Displaying code in Streamlit
Use st.code to display code on Streamlit apps.
#Code
#average of a list
code = '''def cal_average(numbers):
    sum_number = 0
    for t in numbers:
        sum_number = sum_number + t

    average = sum_number / len(numbers)
    return average'''
st.code(code, language='python')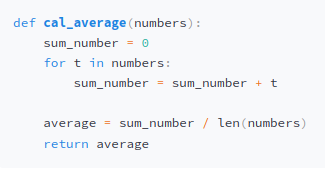
Displaying progress and status in Streamlit
Progress bars and status messages are among the functionalities of Streamlit for adding animation to your apps. The code below implements both the progress bar and status message:
#Progress bar
bar_p = st.progress(0)

for percentage_complete in range(100):
    time.sleep(0.1)
    bar_p.progress(percentage_complete + 1)
#Status message
#display a temporary message when executing a block of code
with st.spinner('Please wait...'):
    time.sleep(5)
st.write('Complete!')
The spinner temporarily displays the Please wait ... message while the code is being executed while the progress bar shows the code's completion percentage. Once the execution is complete, a status message Complete! is displayed.

Other progress bar and status message widgets can be generated using:
st.balloons for displaying celebratory balloons.st.warningfor warning messages.st.infoto display general information.st.successfor showing success messages.st.exceptionfor printing exception error.st.errorto communicate errors.
#Show celebratory balloons
st.balloons()

#Show an error message
st.error("An Error was encountered")

#Display a warning message
st.warning("Incompatible data point!")

#Display informational messages
st.info("Page is refreshed every 2 hours")

#Display success messages
st.success("Record found!")

#Display an exception in your application
exp = ValueError('This is an exception of type ValueError')
st.exception(exp)
Displaying charts in Streamlit
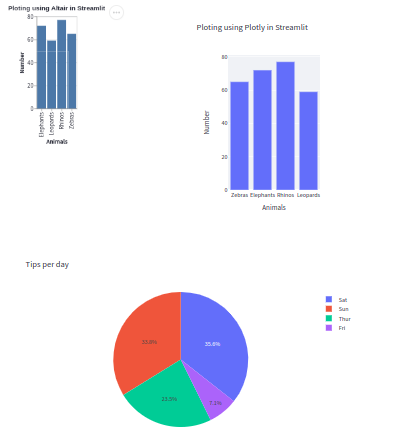
Streamlit allows you to visualize plots generated using different libraries. Below is an illustration of the visualizations generated using various libraries.
Plotly
#plotly
import plotly.express as px
# This data frame has 244 rows, but 4 unique entries for the `day` variable
df = px.data.tips()
fig = px.pie(df, values='tip', names='day')
# Plot!
st.plotly_chart(fig, use_container_width=True)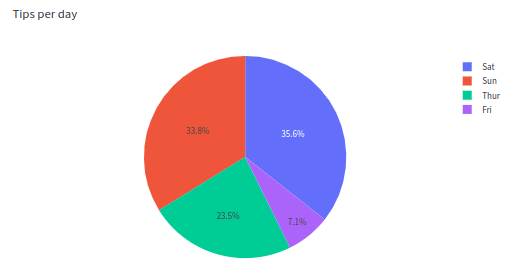
Altair
#Altair
import altair as alt
import streamlit as st
import numpy as np

df = pd.DataFrame(
     np.random.randn(300, 4),
     columns=['a', 'b', 'c', 'd'])

chrt = alt.Chart(df).mark_circle().encode(
     x='a', y='b', size='c', color='c', tooltip=['a', 'b', 'c', 'd'])

st.altair_chart(chrt, use_container_width=True)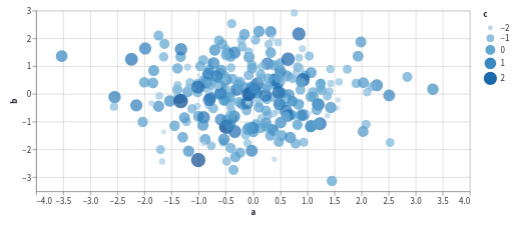
As shown below, Streamlit supports many popular visualization methods which follow the same format for displaying charts in Streamlit web apps.
Matplotlib
#Matplotlib
import matplotlib.pyplot as plt
import numpy as np

arr = np.random.normal(1, 1, size=1000)
fig, ax = plt.subplots()
ax.hist(arr, bins=30)
plt.grid()
st.pyplot(fig)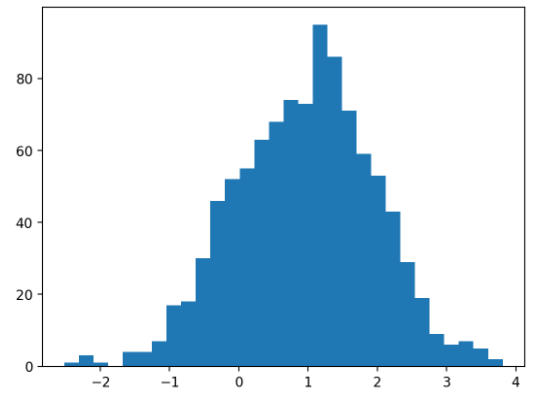
#vega-lite
st.vega_lite_chart(data)
#matplotlib
st.pyplot(fig)
#seaborn
st.pyplot(fig)
#deck.gl
st.deck_gl_chart(data)
#pyDeck
st.pydeck_chart(data)
#bokeh
`st.bokeh_chart()`Interactive widgets in Streamlit
In Streamlit, you can integrate the web app with numerous interactive widgets allowing users to interact with the application and exploit its capabilities. Some of these widgets include:
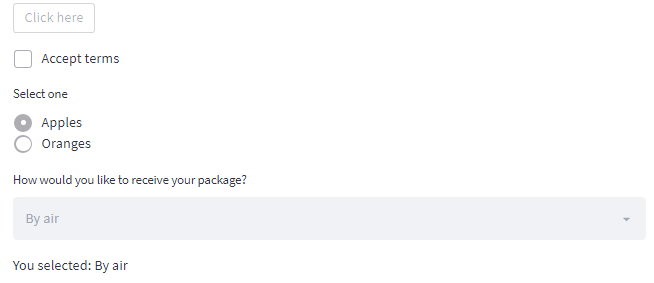
Button
st.button("Click here")Check box
selected = st.checkbox("Accept terms")Select box
option = st.selectbox(
     'How would you like to receive your package?',
     ('By air', 'By sea', 'By rail'))

st.write('You selected:', option)
The expected output from the widgets include
Date input
import datetime
day = st.date_input(
     "When is your birthday?",
     datetime.date(2022, 7, 6))
st.write('Your birthday is:', day)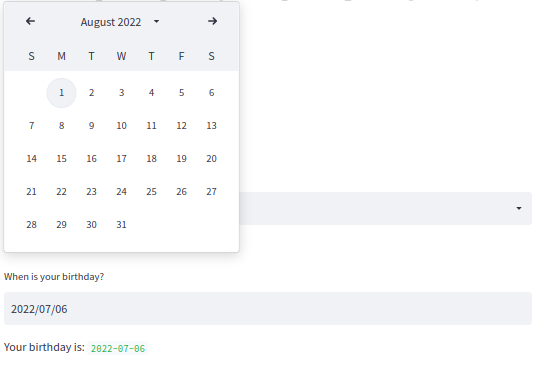
Other interactive widgets can be created using the following codes:
#Multi select
selections = st.multiselect("Purchase", ["oranges", "apples", "bananas"])
#Number input
choice = st.number_input("Choose a number", 0, 50)
#Text area
text = st.text_area("Start typing")
#Time input
time = st.time_input("Dinner time")
#file upload
data = st.file_uploader("Share excel file")
#Slider
num = st.slider("Pick a number", 0, 5)
#Select slider
fruit = st.select_slider("Pick a fruit", ["Apple", "Orange", "Berries"])
Color picker
color = st.color_picker('Choose A Color', '#00FFAA')
st.write('The selected color is', color)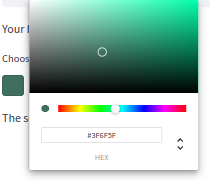
Streamlit also allows you take image input from the user's web cam.
Caching in Streamlit
Caching involves storing data in a cache — a temporary storage area. Caching prevents your app from loading the data each time a function is applied to the same data, and no changes have been made to the function's name, actual code in the function, and the input parameters, e.g., data or a list. Caching improves the speed of the web app.
@st.cache
def fetch_data():
    df = pd.read_csv("students.csv")
    return df

data = fetch_data()
You can set the persist argument to True to allow the cache to persist on disk:
@st.cache(persist = True)
def fetch_data():
    df = pd.read_csv("students.csv")
    return df
data = fetch_data()
To prevent hashing of the return values, the allow_output_mutation argument is set to True.
@st.cache(allow_output_mutation = True)
def fetch_data():
    df = pd.read_csv("students.csv")
    return df
data = fetch_data()
Also, you can pass a custom hash function and override the default hashing behavior:
@st.cache(hash_funcs={MongoClient: id})
def data_from_database(database):
    df = pd.DataFrame(database)
    return df
data = data_from_database()
Check the caching in Streamlit documentation to learn more.
Streamlit configurations
Streamlit offers four different methods to set your configuration options:
- In a global config file.
- Per-project config file.
- Using the environment variables.
- As flags on the command line.
In a global file
For macOS or Linux navigate to ~/.streamlit/config.toml file. For Windows users, navigate to %userprofile%/.streamlit/config.toml. For example, you can change the default port used to serve Streamlit apps:
[server]
port = 8501
In a per-project config file
Navigate to $CWD/.streamlit/config.toml, where $CWD is the folder from which you are running Streamlit.
export STREAMLIT_SERVER_PORT = 8501
export STREAMLIT_SERVER_COOKIE_SECRET = remembertochange
As flags on the command line
These configurations are made when you are running your Streamlit app using streamlit run:
streamlit run yourapp.py --server.port 8501Through environment variables
Using STREAMLIT* environment variables through the command line interface (CLI):
export STREAMLIT_SERVER_PORT = 8501
export STREAMLIT_SERVER_COOKIE_SECRET = remembertochange
Integrating visualization libraries with Streamlit
Streamlit's seamless integration with visualization libraries such as Matplotlib and Seaborn, Plotly, Vega-Lite, and Altair, allows the user to embed visualizations in their web apps.
This section explores the use of Streamlit with popular visualization libraries. We use a fictitious zoo data to demonstrate this.
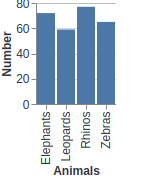
Using Matplotlib and Seaborn in Streamlit
When creating visualizations using Matplotlib or Seaborn, you will need to define a figure instance and supply it to st.pyplot.
Matplotlib
import matplotlib.pyplot as plt
import numpy as np
fig = plt.figure()
ax = fig.add_axes([0,0,1,1])
#fictitious zoo information
animals = ["Zebras", "Elephants", "Rhinos", "Leopards"]
number = [65, 72, 77, 59]
ax.bar(animals, number)
fig = plt.show()
    st.pyplot(fig, caption = "Matplotlib visualization)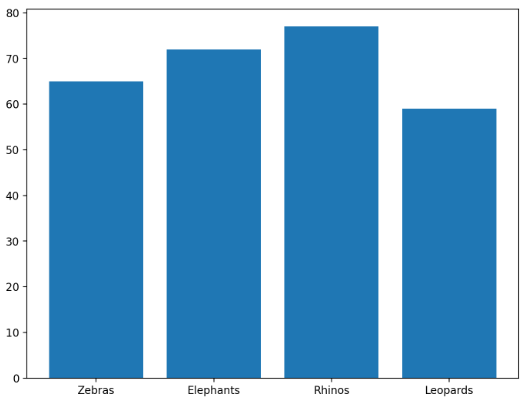
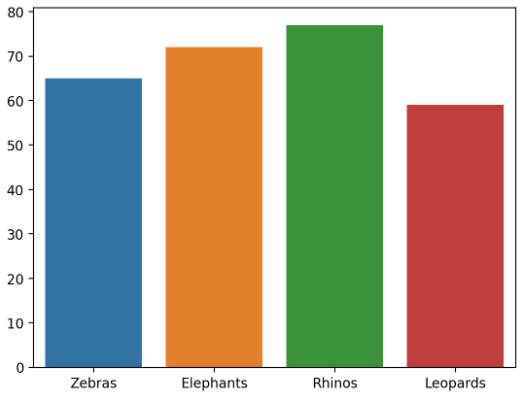
Seaborn
animals = ["Zebras", "Elephants", "Rhinos", "Leopards"]
number = [65, 72, 77, 59]
import seaborn as sns
fig = plt.figure()
ax = sns.barplot(x = animals, y = number)
fig = plt.show()
st.pyplot(fig)
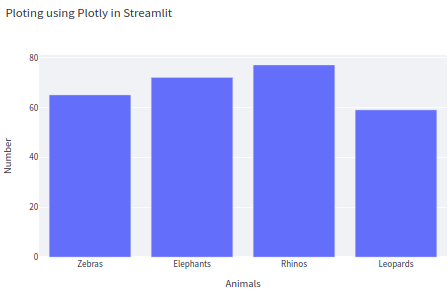
Integrating Plotly in Streamlit
There are three parts to integrating Plotly in Streamlit:
- Python code for declaring the DataFrame.
- Code to draw the visualization.
- The part that renders the web app.
The bar plot is defined using px.bar() and saved to a container that is passed to st.plotly_chart() for rendering. The code below generates a bar plot for the zoo data.
#define data
df = pd.DataFrame()
df["Animals"] = animals
df["Number"] = number
#create plot
fig = px.bar(df, x='Animals', y='Number', title="Ploting using Plotly in Streamlit")
# Plot!
st.plotly_chart(fig, use_container_width=True)
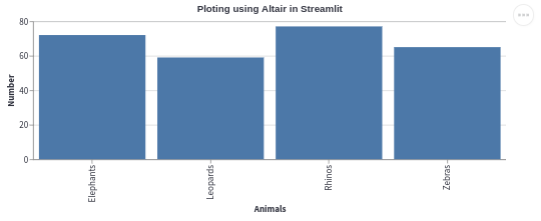
Using Altair in Streamlit
Altair uses the same format as the other libraries explored above. First, you define the data, create your visual presentation using the syntax offered by the library and store the figure in a container which is then passed to Streamlit for displaying as a web app. In Altair, you will define a chart using altair.Chart() and then display it using st.altair_chart()
The code below illustrates an implementation of a bar plot in Altair.
#Altair
#define data
df = pd.DataFrame()

df["Animals"] = animals
df["Number"] = number
#create chart
chrt = alt.Chart(df, title="Ploting using Altair in Streamlit").mark_bar().encode(
    x='Animals',
    y='Number'
)
#render with Streamlit
st.altair_chart(chrt, use_container_width=True)
Using Vega-Lite in Streamlit
When you are visualizing using Vega-Lite, you can define both the data and the visualization parameters in the Streamlit function st.vega_lite_chart as shown below using the zoo data.
#data
df = pd.DataFrame()
df["Animals"] = animals
df["Number"] = number
#visualization
st.vega_lite_chart(df, {
     'mark': {'type': 'bar', 'tooltip': True},
     'encoding': {
         'x': {'field': 'Animals', 'type': 'nominal'},
         'y': {'field': 'Number', 'type': 'quantitative'},
     },
 })
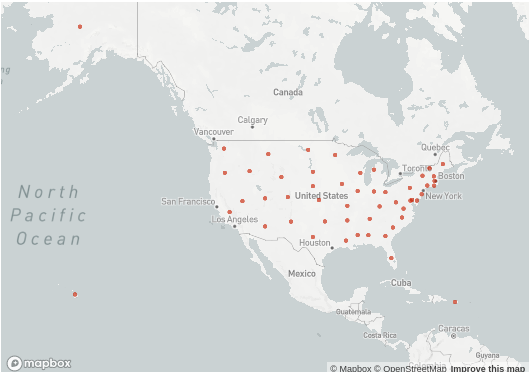
Visualize maps with Streamlit
Streamlit also enables you to plot coordinate data into geographical maps. The code below implements a map of the states in the United States using data obtained from Google developers.
#Maps
import pandas as pd
states = pd.read_html('https://developers.google.com/public-data/docs/canonical/states_csv')[0]
states.columns = ['state', 'lat', 'lon', 'name']
states = states.drop(['state', 'name'], axis = 1)

st.map(states)
Streamlit components
In Streamlit, components are the third-party Python modules that extend the capabilities of Streamlit. The process of using Streamlit components involves:
- Determine and find the component you want to use (if you are unsure where to begin, check out component gallery and this thread by Fanilo A.)
- Using your preferred package manager (e.g., PIP, Conda, and EasyInstall) install the selected component by following the instructions in the components manual. For instance, to install AgGrid Component, you can use the following code:
pip install streamlit-aggrid
Use the installed component as usual by importing it in Python.
from st_aggrid import AgGrid
You can now use the component depending on its intended purpose.
AgGrid(my_dataframe)
You can also create components. For further information on creating Streamlit components, check the Create Component docs on Streamlit.
Add statefulness to Streamlit applications
Each access to a Streamlit app is known as a session. Every browser tab that is connected to the Streamlit server, e.g., http://localhost:8501/. Streamlit reruns the code top to bottom for each script change without sharing variables during the reruns. A Session State allows sharing of variables between reruns for every session.
    import streamlit as st

    st.title('Streamlit Counter Example')
    count = 0

    add = st.button('Addition')
    if add:
        count += 1

    st.write('Count = ', count)
In the example above, when you press the Addition button, the count increases but is reset when the Session State changes. To solve this, you can add a Session State as shown below:
st.title('Counter Session State')
if 'count' not in st.session_state:
    st.session_state.count = 0

increment = st.button('Add')
if increment:
    st.session_state.count += 1

st.write('Count = ', st.session_state.count)
You will notice that pressing the Add button will increment the count and reset the session for Addition Count but
Laying out your Streamlit application
Streamlit allows you to define the layout of your application and how the elements will be displayed on a screen using containers and columns. Layout features that can be used to design your app layout are:
st.columns: Side-by-side columns where you can add Streamlit elements.st.expander: An expand or collapse widget used to show objects selected by a user.st.container: The basic building block of a Streamlit app layout.with column1: st.write("hello!"): Syntax to specify which container to use for the element in question.
#Layout
col1, col2 = st.columns(2)

with col1:
    st.altair_chart(chrt)
with col2:
    st.plotly_chart(fig1, use_container_width=True)
with st.container():
    st.plotly_chart(figx, use_container_width=True)
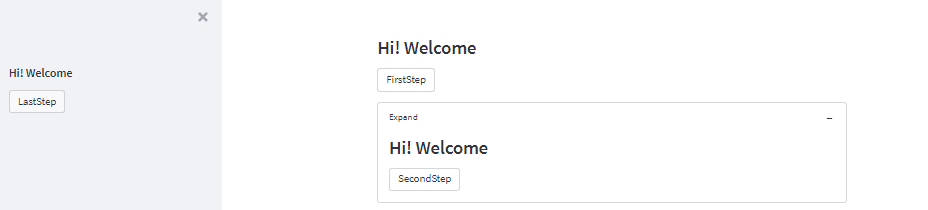
You can also define a sidebar for your Streamlit application using the code below:
#Add side widget

def your_widget(key):
    st.subheader('Hi! Welcome')
    return st.button(key + "Step")

# Displayed in the main area
clicked = your_widget("First")

# Shown within an expander
your_expander = st.expander("Expand", expanded=True)
with your_expander:
    clicked = your_widget("Second")

# Shown in the st.sidebar!
with st.sidebar:
    clicked = your_widget("Last")
Multi-page streamlit apps
You may want to organize an app in multi-pages as the number of pages increases. Streamlit allows you to create multi-page apps easily. When creating multi-pages using Streamlit, pages are shown automatically and can be accessed from the navigation widget. A user can toggle between the pages in the multi-page app using st.selectbox. For example, for the Seaborn, Matplotlib, and Altair plots and the students table, you can create three pages as shown below.
import streamlit as st
def main_page():
#Matplotlib
st.set_option('deprecation.showPyplotGlobalUse', False)
import matplotlib.pyplot as plt
import numpy as np
fig = plt.figure()
ax = fig.add_axes([0,0,1,1])
animals = ["Zebras", "Elephants", "Rhinos", "Leopards"]
number = [65, 72, 77, 59]
ax.bar(animals, number)
fig = plt.show()
st.pyplot(fig)
#Seaborn
import seaborn as sns
fig = plt.figure()
ax = sns.barplot(x = animals, y = number)
fig = plt.show()
st.pyplot(fig)
st.sidebar.markdown("Seaborn and Matplotlib")
def page2():
import pandas as pd
import altair as alt
#Altair
#define data
df = pd.DataFrame()
animals = ["Zebras", "Elephants", "Rhinos", "Leopards"]
number = [65, 72, 77, 59]
df["Animals"] = animals
df["Number"] = number
#create chart
chrt = alt.Chart(df, title="Ploting using Altair in Streamlit").mark_bar().encode(
x='Animals',
y='Number'
)
#render with Streamlit
st.altair_chart(chrt, use_container_width=True)
st.sidebar.markdown("Altair")
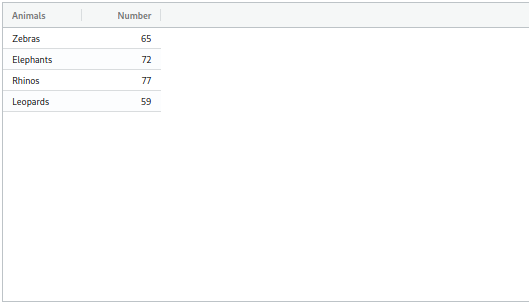
def page3():
students = ["Amelia Kami", "Antoinne Mark", "Peter Zen", "North Kim"]
marks = [82, 76, 96, 68]
import pandas as pd
df = pd.DataFrame()
df["Student Name"] = students
df["Marks"] = marks
#save to dataframe
df.to_csv("students.csv", index = False)
#display
st.dataframe(df)
st.sidebar.markdown("Students info")
page_names_to_funcs = {
"Seaborn and Matplotlib": main_page,
"Altair": page2,
"Data table": page3,
}
selected_page = st.sidebar.selectbox("Select a page", page_names_to_funcs.keys())
page_names_to_funcs[selected_page]()
Information on creating multi-page apps can be found in the documentation.
Theming in Streamlit
Users can define a theme in which they want their apps to be displayed. Themes in Streamlit are defined using the configuration steps defined earlier in this post. A specific theme can be set using the command line flag when starting your app using streamlit run or specifying the theme in the [theme] section of a .streamlit/config.toml file. The following config options show the default Streamlit Dark theme but with a steelblue primaryColor recreated in the [theme] section of a .streamlit/config.toml file.
[theme]
base="dark"
primaryColor="steelblue"
font="serif"
You can also define a white theme and change the primary color to purple.
[theme]
base = #161616
primaryColor = #995FB9
font="mono"
All the configurations that can be applied during theming include primaryColor,backgroundColor,secondaryBackgroundColor,textColor, andfont.
Authenticating Streamlit apps
Except for Streamlit Cloud, one of the features lacking in Streamlit is the ability of a user to design a secure login and authentication service for their applications. The good news is that Streamlit allows the integration of modules such as Streamlit-Authenticator which allow users to securely login into Streamlit applications.
To install run:
pip install streamlit-authenticator
Then import the modules into your app.
import streamlit as st
import streamlit_authenticator as stauth
Using streamlit_authenticator you can hash the passwords.
hashed_passwords = stauth.Hasher(passwords).generate()Create a login window for users using a hash password. You need to store cookies in the browser to authenticate previous users easily. Moreover, you also need to provide a random key used to deal with the signature of the cookie Hash. Also, you have to specify the lifespan of the cookies. If no authentication is required, you can set the value to 0. In the case specified below, the cookies last for 60 days.
authenticator = stauth.Authenticate(names, usernames, hashed_passwords,
    'specified_cookie_name', 'signature_random_key', cookie_expiry_days = 60)
You also need to supply the name of the login form and specify where the form is located.
name, authentication_status, username = authenticator.login('Login', 'main')To ensure only authenticated users have access to restricted content, check that the user is authenticated:
#check authentication status
if authentication_status:
    authenticator.logout('Logout', 'main')
    st.write('Welcome back *%s*' % (name))
    st.title('App contents')
#if the credentials are wrong
elif authentication_status == False:
    st.error('Username and/ password is incorrect')
#if no credentials are supplied
elif authentication_status == None:
    st.warning('Please enter your credentials')
More information on using streamlit_authenticator for authentication can be found on its official Github page.
 mkhorasani
Session State
A Session State provides a way of sharing variables per session between reruns. The Session State of each session follows a field-based API similar to that of Python dictionaries:
# Initialization
if 'key' not in st.session_state:
    st.session_state['key'] = 'value'

# Session State also supports attribute based syntax
if 'key' not in st.session_state:
    st.session_state.key = 'value'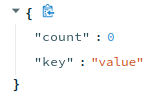
Read the value of an element in the Session State:
# Read
st.write(st.session_state.key)
You can also update a value in a Session State by assigning a value to the Session State.
st.session_state.key = 'value x'     # New Attribute API
st.session_state['key'] = 'value x'  # New Dictionary like API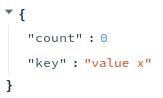
If you want to know more about your Session State, run:
st.write(st.session_state)

# Using magic:
st.session_state
Uploading and processing files in Streamlit
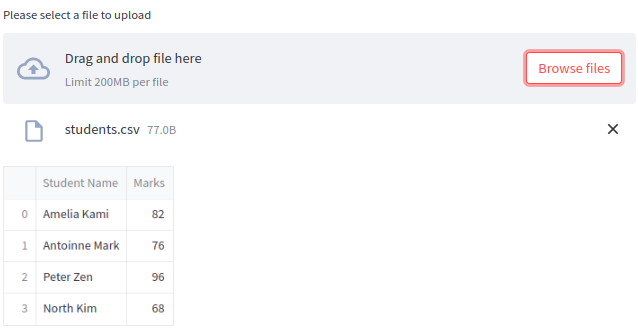
After you have finished your ML app and want to use data stored in a specified location using Streamlit, you can use streamlit.file_uploader which allows you to upload either a single file or multiple files.
Uploading a single file
#Uploading files

import streamlit as st
from io import StringIO

#upload single file and display it as a dataframe
file = st.file_uploader("Please select a file to upload")
if file is not None:
    #Can be used wherever a "file-like" object is accepted:
    df= pd.read_csv(file)
    st.dataframe(df)
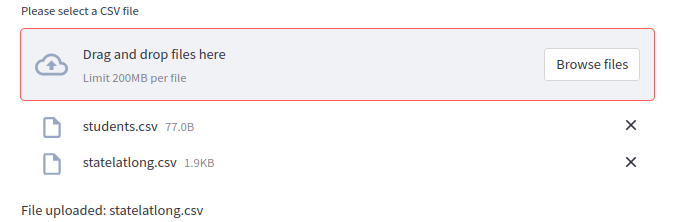
Uploading multiple files
Alternatively, you can upload multiple files as shown below.
#Multiple files
#adding a file uploader to accept multiple CSV file
uploaded_files = st.file_uploader("Please select a CSV file", accept_multiple_files=True)
for file in uploaded_files:
    df = pd.read_csv(file)
    st.write("File uploaded:", file.name)
    st.dataframe(df)
The above illustrations work with CSV files. For additional information on uploading files in Streamlit, see the official documentation.
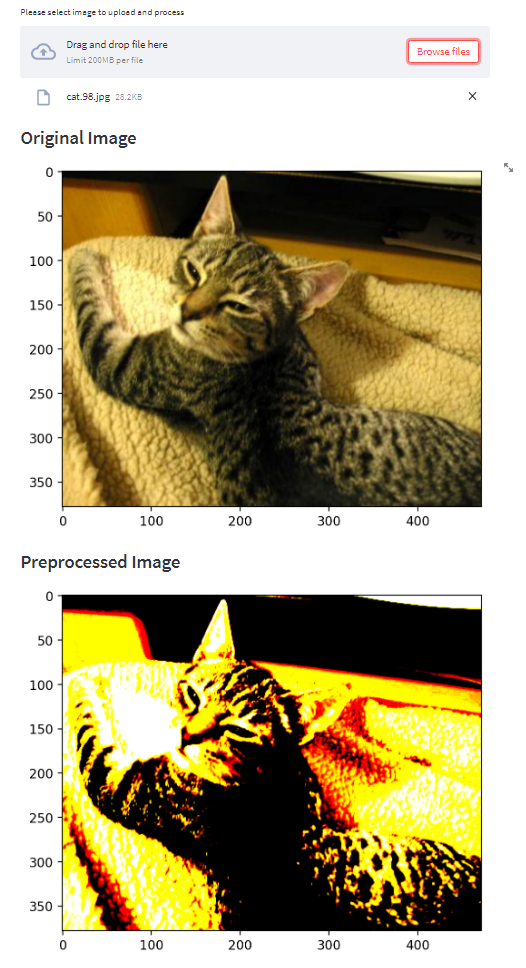
Uploading and processing data
Maybe you want to upload an image and process it. In the example below, we prompt a user to upload an image file and enhance its contrast, then show both the original and the processed images.
#Uploading and Processing
#upload single file
from PIL import Image
from PIL import ImageEnhance
def load_image(image):
    img = Image.open(image)
    return img

file = st.file_uploader("Please select image to upload and process")
if file is not None:
    image = Image.open(file)
    fig = plt.figure()
    st.subheader("Original Image")
    plt.imshow(image)
    st.pyplot(fig)
    fig = plt.figure()
    #Enhance the contrast
    contrast = ImageEnhance.Contrast(image).enhance(12)
    plt.imshow(contrast)
    st.subheader("Preprocessed Image")
    st.pyplot(fig)
Build an image classification application with Streamlit
The core function of Streamlit is to enable machine learning developers to create web apps quickly. Using Streamlit, you can create a web app that uses deep learning for image classification problems. For this tutorial, you will use an Inception ResNet model to predict whether an image is a cat or a dog. The code for creating and training the model is given below.
import PIL
print('Pillow Version:', PIL.__version__)

from PIL import Image

from matplotlib import image
from matplotlib import pyplot
import warnings
warnings.filterwarnings('ignore')
import pandas as pd
import numpy as np
import os
import tensorflow as tf
import numpy as np # linear algebra
import pandas as pd # data processing, CSV file I/O (e.g. pd.read_csv)
import cv2
from tensorflow import keras
from tensorflow.keras.models import Sequential, Model
from  matplotlib import pyplot as plt
import matplotlib.image as mpimg
import random
%matplotlib inline

#generate dataset
IMG_WIDTH=200
IMG_HEIGHT=200
img_path='train'
#generate dataset
IMG_WIDTH=200
IMG_HEIGHT=200
img_path='train1/'
def generate_dataset(img_path):
    img_data_array=[]
    class_name=[]
    for file in os.listdir(os.path.join(img_path)):
        image = cv2.imread( img_path+file, cv2.COLOR_BGR2RGB)
        try:
            image = cv2.resize(image, (IMG_HEIGHT, IMG_WIDTH),interpolation = cv2.INTER_AREA)
        except:
            break
        image = np.array(image)
        image = image.astype('float32')
        image /= 255
        img_data_array.append(image)
        # determine class
        output = 0
        if file.startswith('dog'):
            output = 1
        class_name.append(output)
    return img_data_array, class_name
# Get the image array and class name
img_data, class_name = generate_dataset(img_path)

'''Convert to array'''
img_data=np.array(img_data)
class_name=np.array(class_name)
img_data.shape
'''Dog mapping'''
def dog_cat_mapping(a):
    if a=="dogs":
        return 1
    else:return 0
class_name=list(map(dog_cat_mapping,class_name))
class_name=np.array(class_name)
#input shape for model parameters
input_shape=img_data.shape[1:]
'''Modeling'''
from tensorflow.keras.applications import InceptionResNetV2
conv_base=InceptionResNetV2(weights='imagenet',include_top=False,input_shape=(200,200,3))
#Define the model
def model():
    from tensorflow.keras.models import Sequential
    from tensorflow.keras.layers import Dense, Conv2D, Dropout, Flatten, MaxPooling2D
    model=Sequential()
    model.add(conv_base)
    model.add(Flatten())
    model.add(Dense(256,activation='relu'))
    model.add(Dropout(0.2))
    model.add(Dense(1,activation='sigmoid'))
    return model
model = model()
#check structure
#model.summary()
conv_base.trainable = False
#compile the model
model.compile(optimizer = 'adam',
              loss = 'binary_crossentropy',
              metrics = ['accuracy'])
model.fit(x = img_data,y = class_name, epochs = 2)
#save the model
model.save('catdog.h5')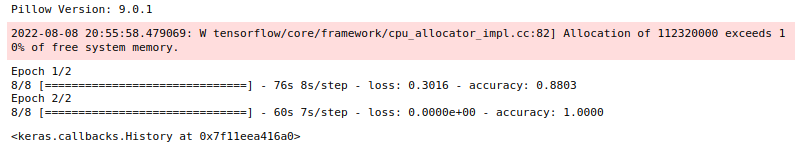
After creating and saving your model, it is time to deploy it with Streamlit.
%%writefile deployment.py
import streamlit as st
import tensorflow as tf
import cv2
from PIL import Image, ImageOps
import numpy as np
import matplotlib.pyplot as plt
import numpy as np
import os
import PIL
import tensorflow as tf
from tensorflow import keras
from tensorflow.keras import layers
from tensorflow.keras.models import Sequential
st.title("Cat/Dog Streamlit Classifier")
st.header("Please input an image to be classified:")
@st.cache(allow_output_mutation=True)
def dog_cat_classifier(img, model):
    '''
    Teachable machine learning classifier for dog-cat classification:
    Parameters
    {
    img: Image to be classified
    model : trained model
    }
    '''
    # Load the model that was saved earlier
    model = keras.models.load_model(model)
    '''Define the array of the right shape to feed into the keras model'''
    data = np.ndarray(shape=(1, 200, 200, 3), dtype=np.float32)
    image = img
    #resizing the image
    size = (200, 200)
    image = ImageOps.fit(image, size, Image.ANTIALIAS)
    #convert the image into a numpy array
    image_array = np.asarray(image)
    # Image processing (normalization)
    normalized_image = (image_array.astype(np.float32) / 255)
    # Load the image into the array
    data[0] = normalized_image
    # carryout predictions
    prediction_rate = model.predict(data)
    prediction = prediction_rate.round()
    return  prediction,prediction_rate
#prompt user for an image
uploaded_image = st.file_uploader("Select an image with Cat or Dog Image...", type="jpg")

if uploaded_image is not None:
    image = Image.open(uploaded_image)
    st.image(image, caption='Uploaded file', use_column_width=True)
    st.write("")
    st.write("Classifying please wait...")
    label,conf = dog_cat_classifier(image, 'catdog.h5')
    if label == 1:
        st.write("This is a Dog, with:",conf, "confidence")
    else:
        st.write("This is a Cat, with:",1-conf, "confidence")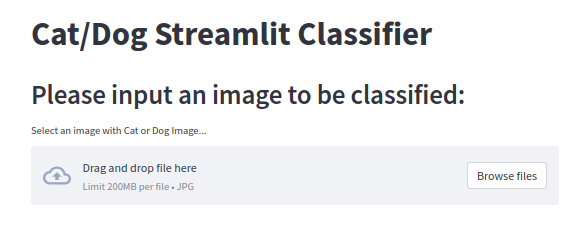
As shown below, a user can upload an image and get an answer to whether the image contains a cat or a dog.
Data for this demonstration was obtained from Kaggle.
Use Hugging face to develop a natural language processing application with Streamlit
Natural language processing has gained popularity thanks to its ability to enable humans to interact with computers in human language. There are many NLP tools; however, in this guide, you will use HuggingFace's Transformers module, which has SOTA NLP models that can be used for tasks such as:
- Named Entity Recognition.
- Masked Language Modeling.
- Sentiment Analysis.
- Feature Extraction.
- Question Answering.
In particular, you will learn to create a web app for the NLP model using Streamlit.
Ensure you have installed the transformers library using pip:
pip install transformers
In your application, you can create the question-answering application as shown below.
'''Hugging Face'''
import streamlit as st
from transformers import pipeline
if __name__ == "__main__":
# Define the title of the and its description
st.title("Answering questions using NLP through Streamlit interface")
st.write("Pose questions, get answers")
# Load file
raw_text = st.text_area(label="Enter a text here")
if raw_text != None and raw_text != '':
# Display text
with st.expander("Show question"):
st.write(raw_text)
# Conduct question answering using the pipeline
question_answerer = pipeline('question-answering')
answer = ''
question = st.text_input('Ask a question')
if question != '' and raw_text != '':
answer = question_answerer({
'question': question,
'context': raw_text
})
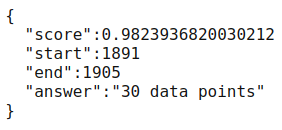
st.write(answer)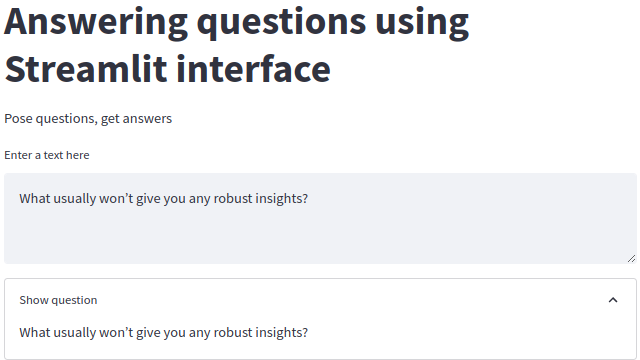
The output from the above question is:
Additional examples using Hugging Face can be found on the Hugging Face examples page.
Connecting to data sources with Streamlit
Your app probably connects to a data source to carry out some functionality. The data source could be a simple CSV file stored in a Github repo, an AWS database, or any other cloud service provider. Streamlit allows you to connect to various databases and APIs. Below is a demonstration of how to connect Streamlit with various data sources.
AWS
Streamlit connects to Amazon Web Services application Amazon S3 through a web interface. Details on connecting Streamlit to AWS can be found in Amazon Open Source Blog and the official documentation.
BigQuery
BigQuery allows scalable analysis using large datasets and supports querying using ANSI SQL. You will need to:
- Create an account or sign in and head over to the APIs & Services dashboard (select or create a project depending on the directions)
- Create a service account and file if you want to use the BigQuery API from Streamlit Cloud.
- Add the resulting key to your local app secrets that are stored in
.streamlit/secrets.toml. If the file does not exist, you can create it.
# .streamlit/secrets.toml

[gcp_service_account]
type = "service_account"
project_id = "project_id"
private_key_id = "private_key_id"
private_key = "private_key"
client_email = "client_email"
client_id = "client_id"
auth_uri = "https://accounts.google.com/o/oauth2/auth"
token_uri = "https://oauth2.googleapis.com/token"
auth_provider_x509_cert_url = "https://www.googleapis.com/oauth2/v1/certs"
client_x509_cert_url = "client_x509_cert_url"
You can now add the google-cloud-bigquery==version package to your requirements file.
To connect Streamlit to BigQuery, you can now use the following code.
# streamlit_app.py

import streamlit as st
from google.oauth2 import service_account
from google.cloud import bigquery

# Create API client.
credentials = service_account.Credentials.from_service_account_info(
    st.secrets["gcp_service_account"]
)
client = bigquery.Client(credentials=credentials)

# Perform query.
# Uses st.experimental_memo to only rerun when the query changes or after 10 min.
@st.experimental_memo(ttl=600)
def run_query(query):
    query_job = client.query(query)
    rows_raw = query_job.result()
    # Convert to list of dicts. Required for st.experimental_memo to hash the return value.
    rows = [dict(row) for row in rows_raw]
    return rows

rows = run_query("SELECT word FROM `bigquery-public-data.samples.shakespeare` LIMIT 10")

# Print results.
st.write("Some wise words from Shakespeare:")
for row in rows:
    st.write("✍️ " + row['word'])
MongoDB
After creating your MongoDB database, follow the instructions in the official documentation on installing MongoDB and setting up authentication. After you are done, open mongo terminal and create a collection of people and their pets, as an example.
use mydb
db.mycollection.insertMany([{"name" : "Mary", "pet": "dog"}, {"name" : "John", "pet": "cat"}, {"name" : "Robert", "pet": "bird"}])
Add the credentials you obtained from setting up authentication to your local app secrets in the .streamlit/secrets.toml file in the root directory of your app. You can create this file if it is not created yet and add the following details:
[mongo]
host = "localhost"
port = 27017
username = "username"
password = "password"
Copy the secrets to the cloud by going to dashboard and from the apps drop-down, go to Edit Secrets copy the contents of secrets.toml and paste in the text area (see Secrets Management).
Now, the Streamlit app can be written as shown below.
# streamlit_app.py
import streamlit as st
import pymongo
# Initialize connection.
# Uses st.experimental_singleton to only run once.
@st.experimental_singleton
def init_connection():
return pymongo.MongoClient(**st.secrets["mongo"])
client = init_connection()
# Pull data from the collection.
# Uses st.experimental_memo to only rerun when the query changes or after 10 min.
@st.experimental_memo(ttl=600)
def get_data():
db = client.mydb
items = db.mycollection.find()
items = list(items) # make hashable for st.experimental_memo
return items
items = get_data()
# Print results.
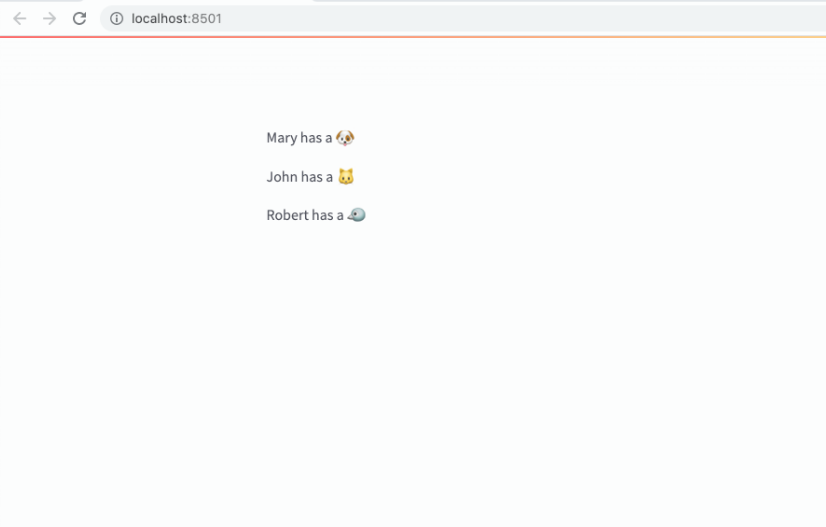
for item in items:
st.write(f"{item['name']} has a :{item['pet']}:")If everything went well, the output from the app should be something like:
See the official Streamlit MongoDB documentation for further instructions on connecting MongoDB to Streamlit.
PostgreSQL
First, install PostgreSQL and note your database name, username, and password. Add the secrets to the .streamlit/secrets.toml file.
[postgres]
host = "localhost"
port = 5432
dbname = "dbname"
user = "user"
password = "password"
Copy your secrets to the cloud as shown in Secrets Management then add psycopg2 package to your requirements.txt
psycopg2-binaryThe next step will be to create a table in the SQL Shell (.psql)
CREATE TABLE mytable (
    name            varchar(80),
    pet             varchar(80)
);

INSERT INTO mytable VALUES ('Mary', 'dog'), ('John', 'cat'), ('Robert', 'bird');
In your Streamlit app, you can query the table created for PostgreSQL, as shown below.
import streamlit as st
import psycopg2

# Initialize connection.
# Uses st.experimental_singleton to only run once.
@st.experimental_singleton
def init_connection():
    return psycopg2.connect(**st.secrets["postgres"])

conn = init_connection()

# Perform query.
# Uses st.experimental_memo to only rerun when the query changes or after 10 min.
@st.experimental_memo(ttl=600)
def run_query(query):
    with conn.cursor() as cur:
        cur.execute(query)
        return cur.fetchall()

rows = run_query("SELECT * from mytable;")

# Print results.
for row in rows:
st.write(f"{row[0]} has a :{row[1]}:")The expected output is:

Other popular databases that can be connected to Streamlit include:
- Snowflake
- Microsoft SQL Server
- Firestore
- Tableau
- Private
- Google datasheet
- MySQL
- TigerGraph
- Deta base
- Superbase
- Google Cloud storage
Deploying Streamlit applications
After building your applications, it is time to share them with your target audience. There are various methods for deploying Streamlit apps. This guide shows how to deploy applications using Streamlit sharing, Heroku, and Hugging Face spaces.
Streamlit sharing
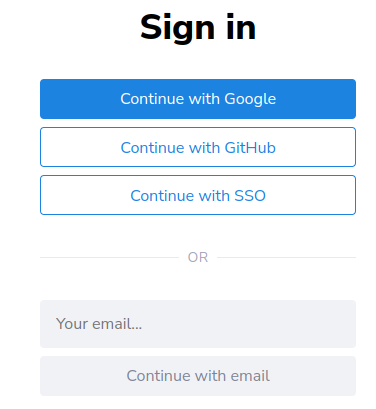
With Streamlit, you can deploy, manage, and share your apps for free. The steps to deploy with Streamlit sharing are easy.
Go to https://share.streamlit.io/ and sign in with Github, SSO, Google, or your email.
Select a repo, branch, and file
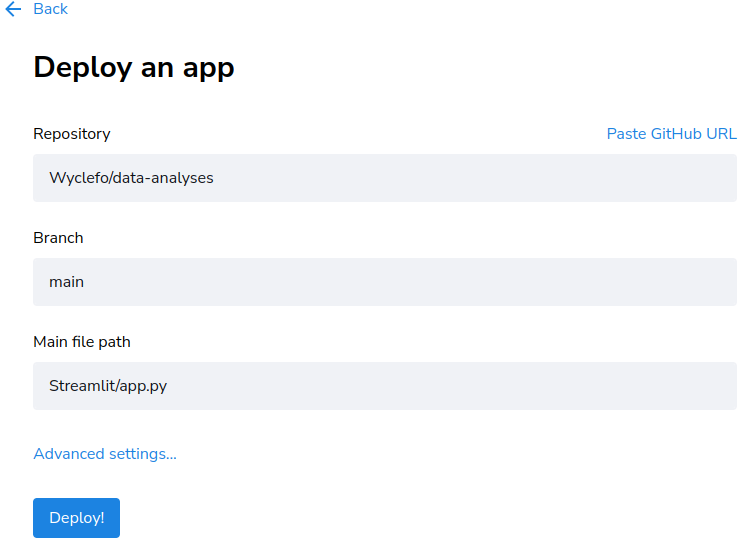
You can also use a link to the app on Github.
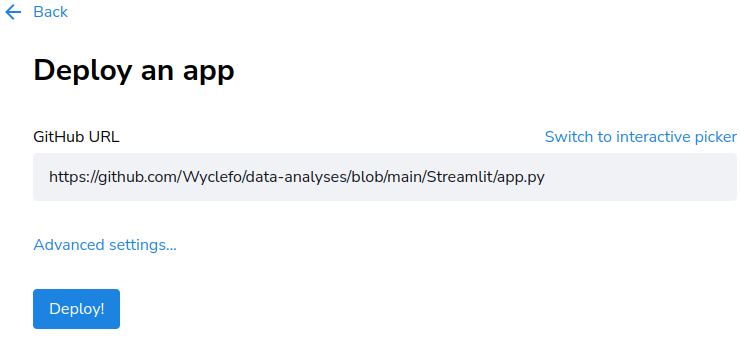
After completing the above process, click Deploy and let Streamlit share handle the rest of the deployment.
Heroku
You can also deploy your Streamlit application to Heroku. You will need the following files:
- Procfile - informs Heroku about the type of your application (in this case, Python)
stweb: sh setup.sh && streamlit run Streamlit/app.py- Requirement.txt - contains all the packages needed for the application.
streamlit == x.x.x
pandas == x.x.x
matplotlib == x.x.x
altair == x.x.x
seaborn == x.x.x
numpy == x.x.x
plotly == x.x.x- A
setup.shfile - contains information about Streamlit configurations
mkdir -p ~/.streamlit/

echo "\
[general]\n\
email = \"email@domain\"\n\
" > ~/.streamlit/credentials.toml

echo "\
[server]\n\
headless = true\n\
enableCORS=false\n\
port = $PORT\n\
" > ~/.streamlit/config.toml
With that in place, you can continue your usual Heroku deployment process.

Hugging Face spaces
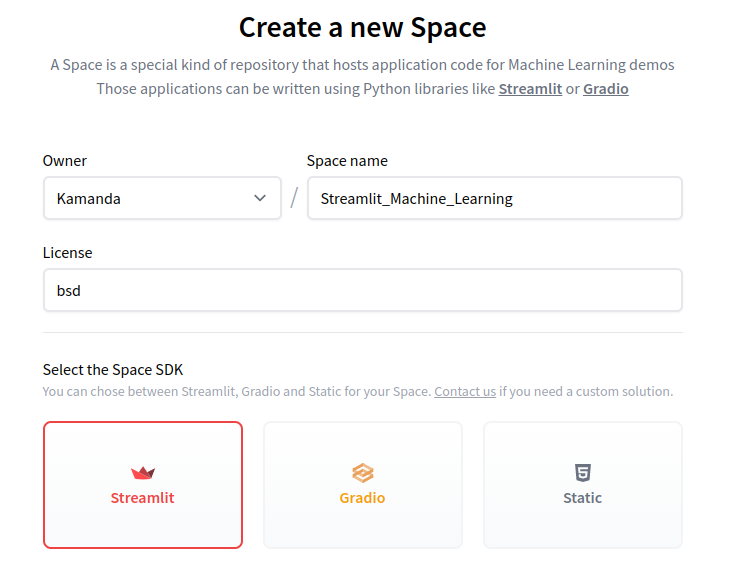
Create an account at https://huggingface.co/ and create a New Space by clicking on Spaces in the navigation bar.

Fill in the details as requested.
You will be taken to a page with a repo. Copy the link in your command prompt.
git clone https://huggingface.co/spaces/Kamanda/Streamlit_Machine_LearningYour code will be different depending on the details that your supplied.
A new folder with the name of your new space will be created in your machine.
- Copy your
app.py,requirements.txtand any other supporting file into this new folder. - In your terminal, run the following commands, replacing the respective names with that of your workspace.
cd Streamlit_Machine_Learning
git add .
git commit -m "first commit"
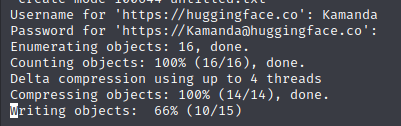
git pushAdd your Hugging Face account username and password:
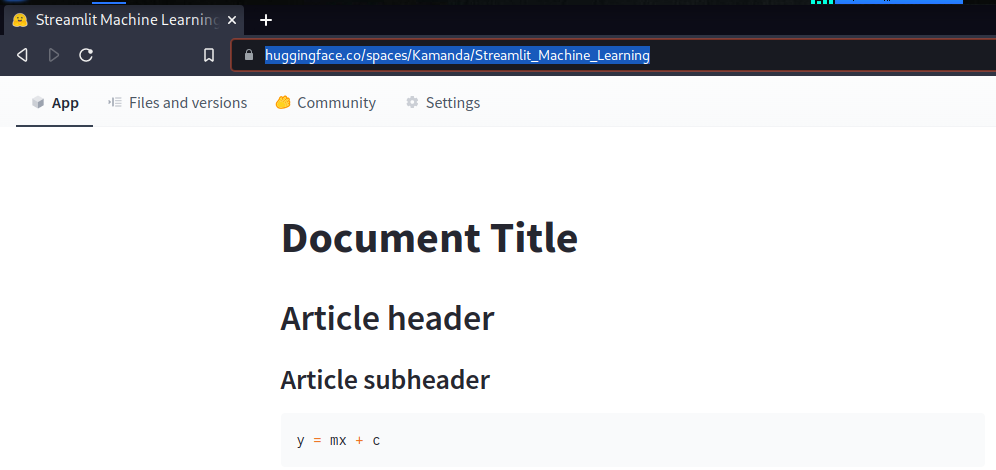
After the execution is complete, go to your Space page, which you had created earlier. Mine is https://huggingface.co/spaces/Kamanda/Streamlit_Machine_Learning. You should see an app running.
Final thoughts
Building web apps has quickly become a popular way of sharing machine learning applications. The potential of web apps in machine learning as a data science tool is tremendous, ranging from using them for live chat with users to dashboard development and image classification. In this tutorial, we used Streamlit to show the applicability of Streamlit as a comprehensive tool for building data analysis and modeling web apps for machine learning developers and data science teams.
In particular, what you have learned includes:
- What is Streamlit?
- How to integrate visualization libraries with Streamlit.
- How to cache in Streamlit applications.
- How to build and use custom Streamlit components.
- How to add authentication in Streamlit apps.
- How to enable statefulness in Streamlit.
- How to set custom themes in Streamlit.
- How to build data science applications with Streamlit.
- How to connect various data sources to Streamlit apps.
- How to deploy Streamlit applications.
Check out our Complete Guide to Data Science Applications with Streamlit to learn more about building data science and machine learning applications with Streamlit.
Follow us on LinkedIn, Twitter, GitHub, and subscribe to our blog, so you don't miss a new issue.