
How to use TensorBoard in JAX & Flax


Tracking machine learning experiments makes understanding and visualizing the model's performance easy. It also makes it possible to spot any problems in the network. For example, you can quickly spot overfitting by looking at the training and validation charts. You can plot these charts using your favorite charts package, such as Matplotlib. However, you can also use more advanced tools such as TensorBoard.
TensorBoard is an open-source library that provides tools for experiment tracking in machine learning. You can use TensorBoard for:
- Tracking and visualizing model evaluation metrics such as accuracy.
- Logging images.
- Visualize hyper-parameter tuning.
- Project embeddings such as word embedding in natural language processing problems.
- Visualize histograms of the model's weights and biases.
- Plot the architecture of the model.
- Profile the performance of the network.
You can use TensorBoard with popular machine learning libraries such as XGBoost, JAX, Flax, and PyTorch.
This article will focus on how to use TensorBoard when building networks with JAX and Flax.
How to use TensorBoard
Let's start by exploring how to use TensorBoard.
How to install TensorBoard
The first step is to install TensorBoard from the Python Index.
pip install tensorboard
Using TensorBoard with Jupyter notebooks and Google Colab
Once TensorBoard is installed, you need to load it in your environment, usually Google Colab or your local notebook.
%load_ext tensorboardNext, inform TensorBoard which folder will contain the log information.
log_folder = "runs"How to launch TensorBoard
Tensorboard is launched using the tensorboard magic command in notebook environments while specifying the logdir.
%tensorboard --logdir={log_folder}
You can also launch TensorBoard on the command line using a similar pattern. Apart from viewing the terminal on the notebook environment, you can also view it on the browser by visiting: http://localhost:6006.
Tensorboard dashboards
TensorBoard has various dashboards for showing different types of information.
The Scalars dashboard tracks numerical information such as training metrics per epoch. You can use it to track other scalar values such as model training speed and learning rate.
The Graphs dashboard is used for showing visualizations. For example, you can use it to check the architecture of the network.
The Distributions and Histograms dashboard show the distribution of tensors over time. Use it to check the weights and biases of the network.
The Images dashboard shows the images you have logged to TensorBoard.
The HParams dashboard visualizes hyperparameter optimization. It helps identify the best parameters for the network.
The Embedding Projector is used to visualize low-level embeddings, for example, text embeddings.
The What-If Tool dashboard helps in understanding the performance of a model. It also enables the measurement of a model's fairness on data subsets.
The TensorFlow Profiler monitors the model training process. It also shows the events in the CPU and GPU during training. The TensorFlow profiler goes further to offer recommendations based on the data collected. You can also use it to debug performance issues in the input pipeline.
Read more: TensorBoard tutorial (Deep dive with examples and notebook)
How to use TensorBoard with Flax
With TensorBoard installed and some basics out of the way, let's look at how you can use it in Flax. Let's use the SummaryWriter from PyTorch to write to the log folder.
How to log images with TensorBoard in Flax
You may want to log sample images when solving computer vision problems. You can also log predictions while training the model. For example, you can log prediction images containing bounding boxes for an object detection network.
Let's look at how we can log an image to TensorBoard. Read the Image classification with JAX & Flax article for a complete example of solving computer vision problems with Flax.
from torch.utils.tensorboard import SummaryWriter
import torchvision.transforms.functional as F

writer = SummaryWriter(logdir)
def show(imgs):
    if not isinstance(imgs, list):
        imgs = [imgs]
    fig, axs = plt.subplots(ncols=len(imgs), squeeze=False)
    for i, img in enumerate(imgs):
        img = img.detach()
        img = F.to_pil_image(img)
        axs[0, i].imshow(np.asarray(img))
        axs[0, i].set(xticklabels=[], yticklabels=[], xticks=[], yticks=[])
writer.flush() # Ensure that everything is written to disk
Next, create a grid with the images that will be logged.
from torchvision.utils import make_grid
from torchvision.io import read_image
from pathlib import Path

cat = read_image(str(Path('train') / 'cat.1.jpg'))
grid = make_grid(cat)
show(grid)
The add_image function is used to write images to TensorBoard.
writer.add_image('sample_cat', grid)
Now, load the TensorBoard extension and point it to the logs folder.
%tensorboard --logdir={logdir}The logged images will be visible on the Images dashboard.
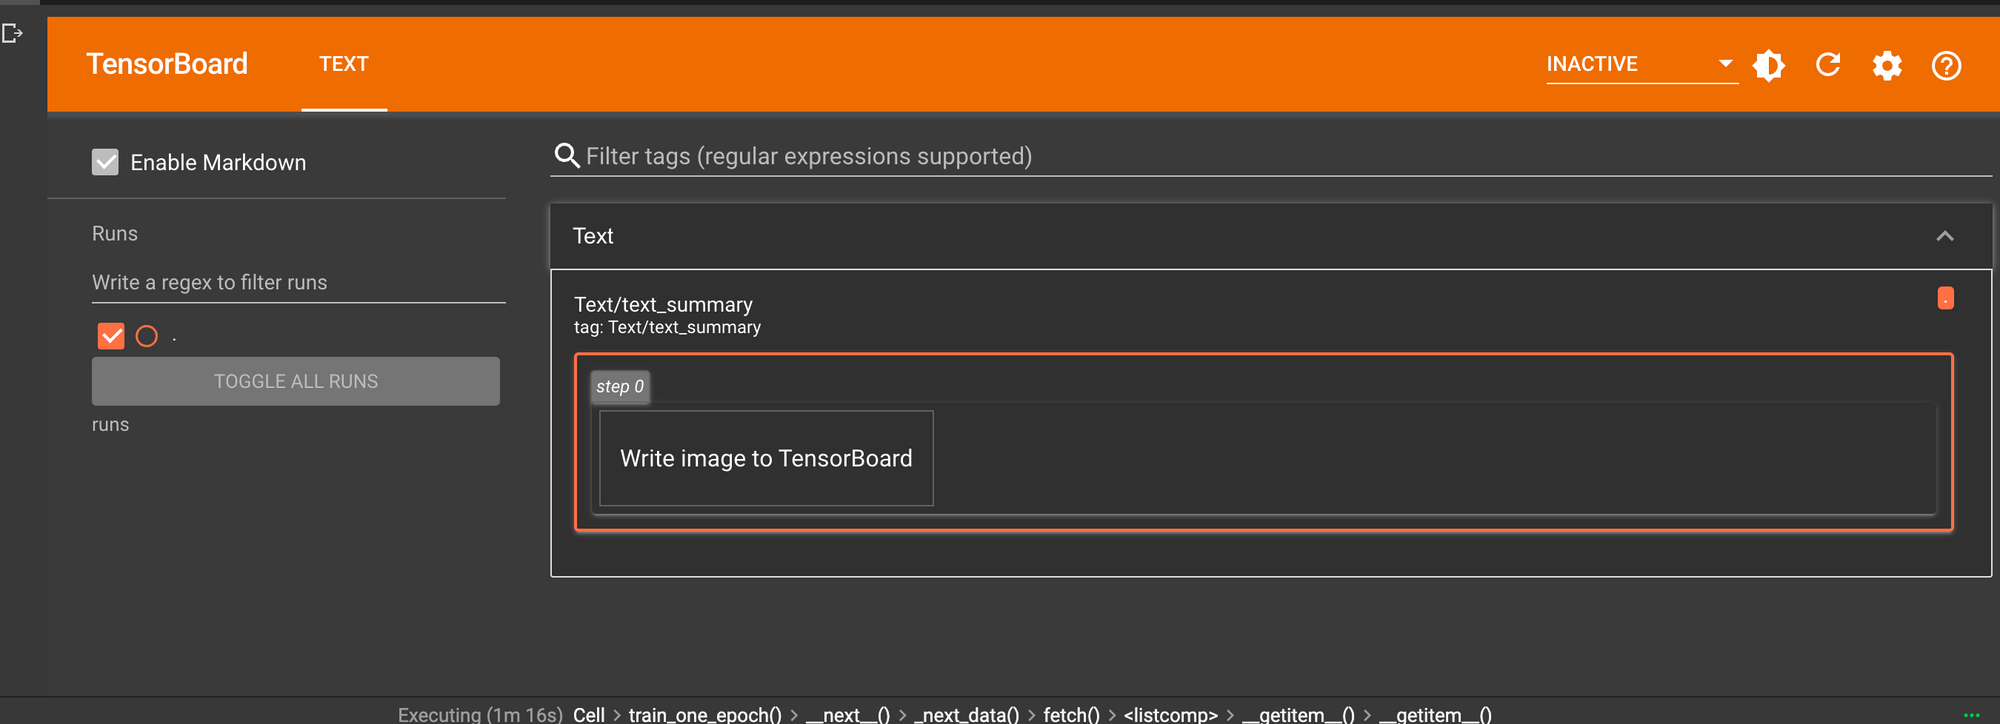
How to log text with TensorBoard in Flax
Writing text to TensorBoard is done using the add_text function.
writer.add_text('Text', 'Write image to TensorBoard', 0)
The logged data is available on the Text dashboard.
Track model training in JAX using TensorBoard
You can log the evaluation metrics when training machine learning models with JAX. They obtained at the training stage. At this point, you can log the metrics to TensorBoard. In the example below, we log the training and evaluation metrics.
for epoch in range(1, num_epochs + 1):
    train_state, train_metrics = train_one_epoch(state, train_loader)
    training_loss.append(train_metrics['loss'])
    training_accuracy.append(train_metrics['accuracy'])
    print(f"Train epoch: {epoch}, loss: {train_metrics['loss']}, accuracy: {train_metrics['accuracy'] * 100}")

    test_metrics = evaluate_model(train_state, test_images, test_labels)
    testing_loss.append(test_metrics['loss'])
    testing_accuracy.append(test_metrics['accuracy'])

    writer.add_scalar('Loss/train', train_metrics['loss'], epoch)
    writer.add_scalar('Loss/test', test_metrics['loss'], epoch)

    writer.add_scalar('Accuracy/train', train_metrics['accuracy'], epoch)
    writer.add_scalar('Accuracy/test', test_metrics['accuracy'], epoch)

print(f"Test epoch: {epoch}, loss: {test_metrics['loss']}, accuracy: {test_metrics['accuracy'] * 100}")![]()
These metrics will be available on the Scalars dashboard of TensorBoard.

How to profile JAX programs with TensorBoard
To profile JAX programs, send data to the TensorBoard profiler. The first step is to install the profile plugin.
pip install -U tensorboard-plugin-profileProgrammatic profiling
Use jax.profiler.start_trace() to start a trace and jax.profiler.stop_trace() to stop a trace. The start_trace() expects the path to the directory where the traces will be written.
import jax

jax.profiler.start_trace("runs")

# Run the operations to be profiled
key = jax.random.PRNGKey(0)
x = jax.random.normal(key, (5000, 5000))
y = x @ x
y.block_until_ready()

jax.profiler.stop_trace()
Manual profiling with TensorBoard
The second option is to profile the JAX program manually.
This is done in the following steps:
- Initialize TensorBoard
tensorboard --logdir /runs - Start a JAX profiler server at the begining of the program and stop the server at the end of the program.
import jax.profiler
jax.profiler.start_server(9999)
train_one_epoch(state, train_loader,num_epochs)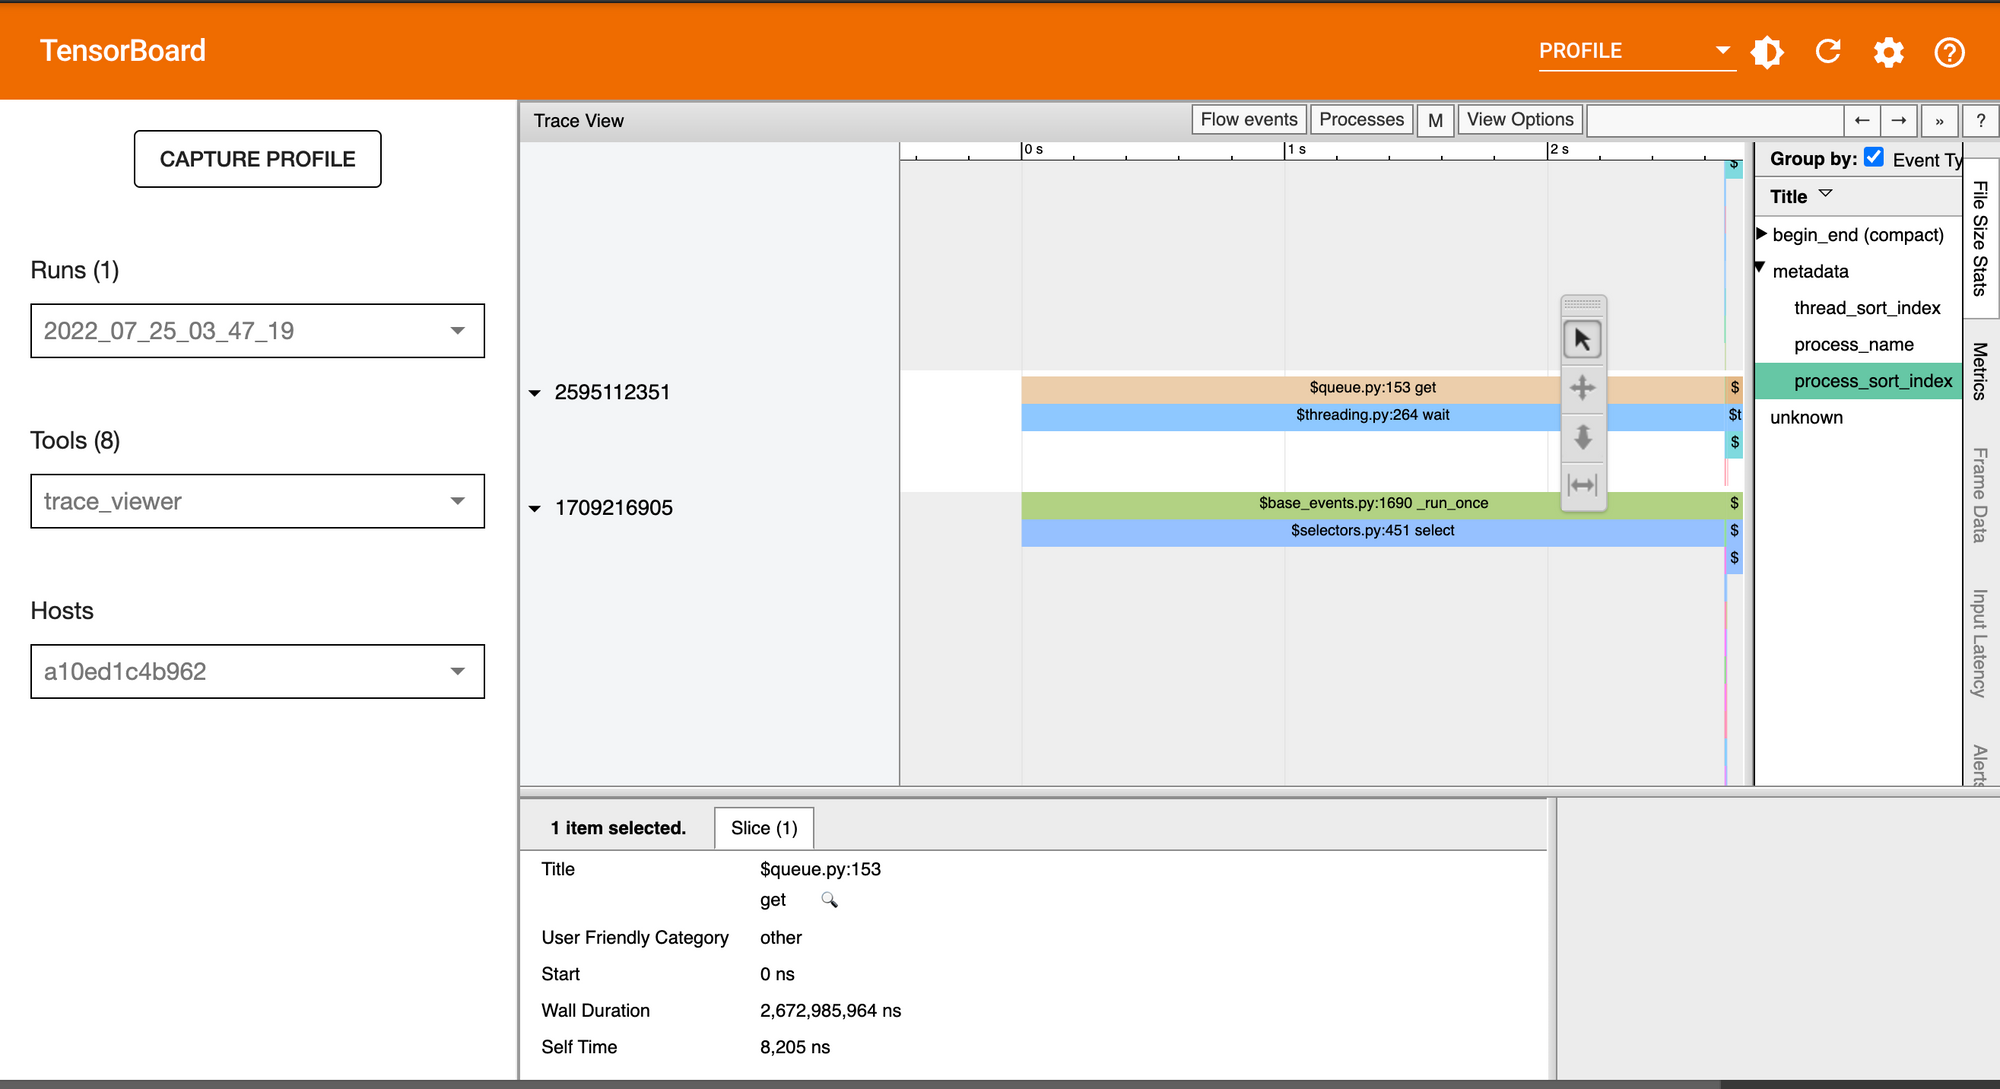
jax.profiler.stop_server()- Open the Profile dashboard of TensorBoard. Click CAPTURE PROFILE and enter the URL of the server that you started above, in this case localhost:9999. Click CAPTURE to start profiling.
- Select trace_viewer under Tools on the profile dashboard. Use the navigation tools here to click specific events to see more information about them.
How to profile JAX program on a remote machine
You can profile a JAX program on a remote server by executing the above instructions on the remote server. This involves starting a TensorBoard server on the remote machine, and port forwarding it to your local machine. You will then access TensorBoard locally via the web UI.
ssh -L 6006:localhost:6006 <remote server address>Share TensorBoard dashboards
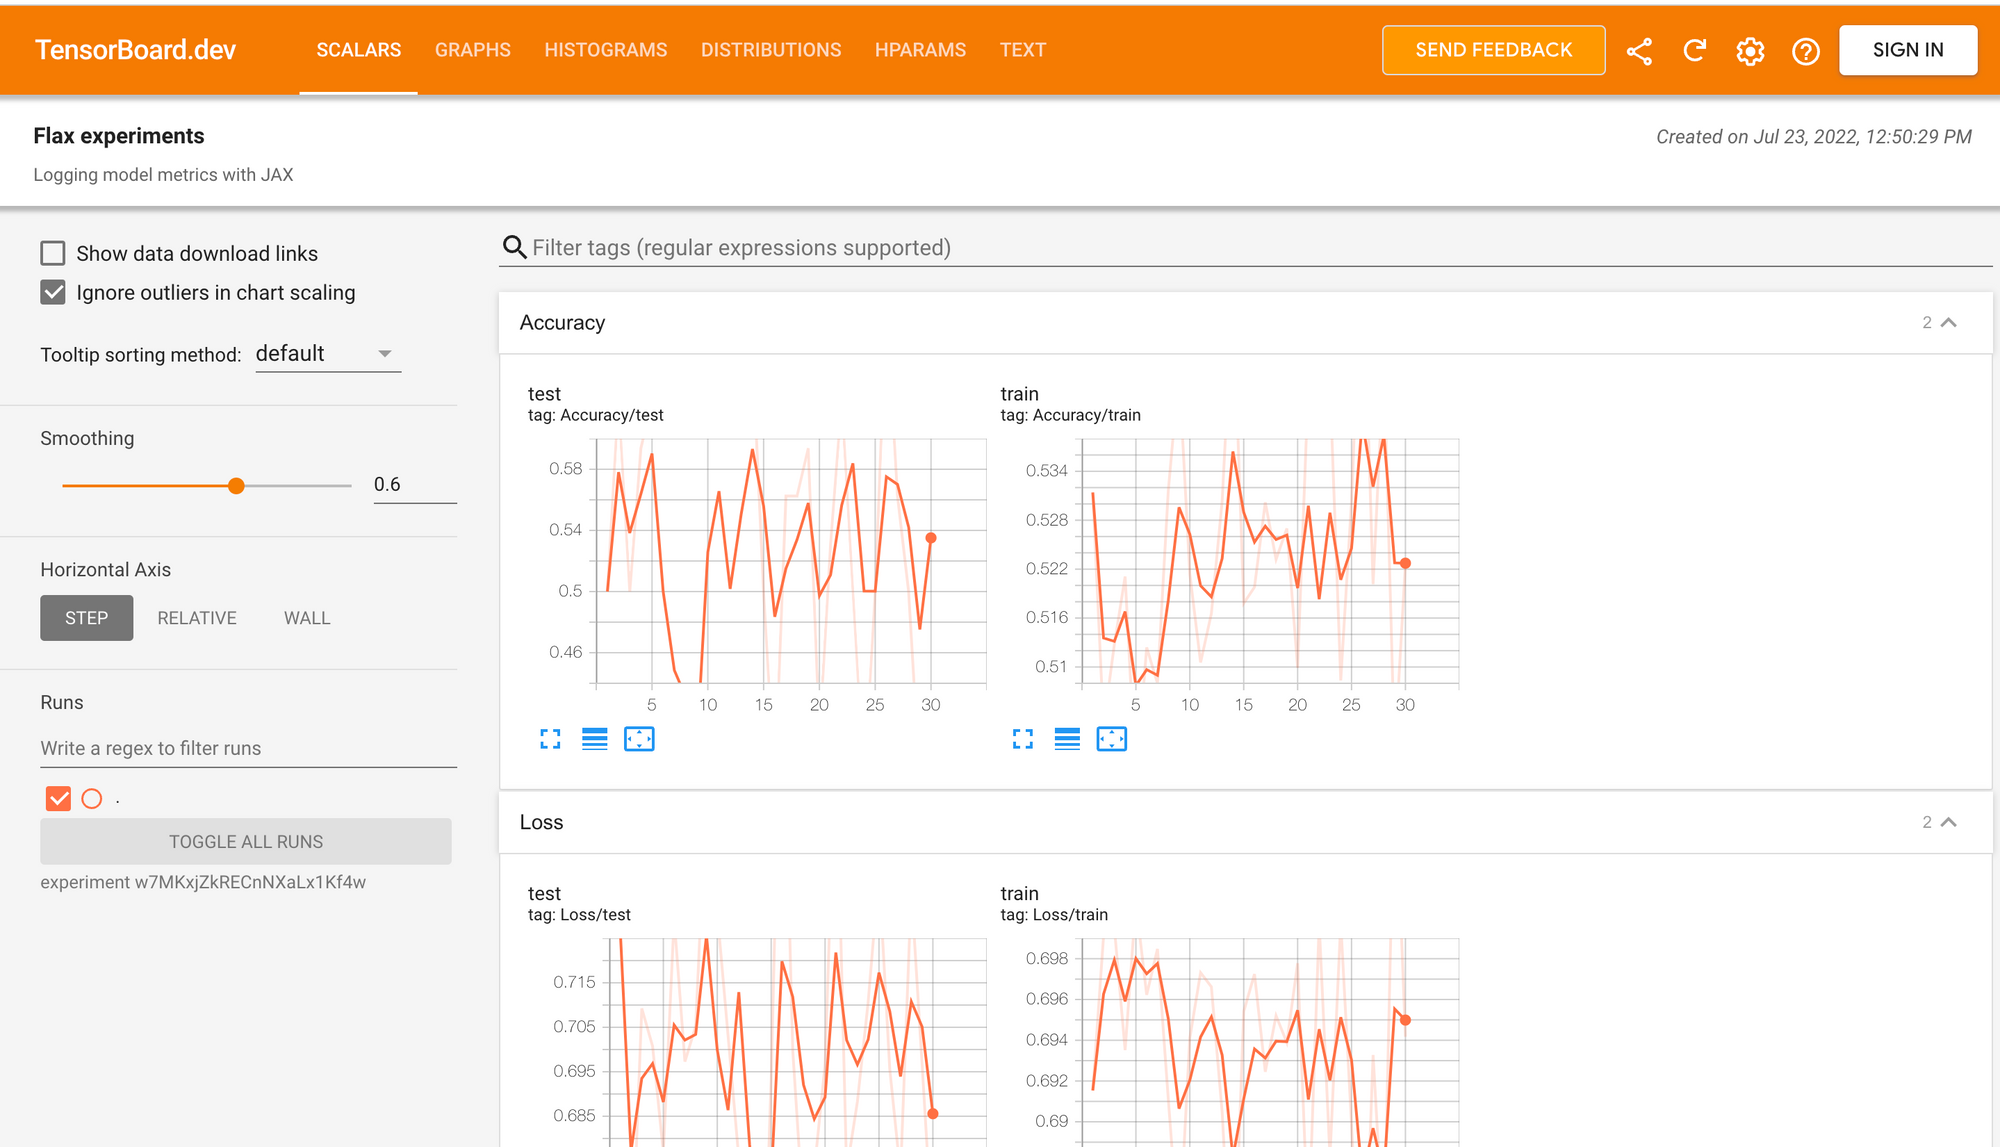
TensorBoard.dev is a hosted version of TensorBoard that makes it easy to share your experiments. Let's upload the above TensorBoard to TensorBoard.dev.
# On Colab or Jupyter nmotebook
!tensorboard dev upload --logdir ./runs \
  --name "Flax experiments" \
  --description "Logging model metrics with JAX" \
  --one_shot
When you run the above code, you will get a prompt to authorize the upload. You should be keen not to share sensitive data because TensorBoard.dev experiments are public.
You can view the experiment on TensorBoard.dev.
Final thoughts
In this article, we have seen how you can use TensorBoard to log your experiments in Flax. More specifically, you have learned:
- What is TensorBoard?
- How to install and launch TensorBoard.
- How to log images and text to TensorBoard.
- How to log model metrics to TensorBoard.
- How to profile JAX and Flax programs using TensorBoard
- How to upload the log to TensorBoard.dev.
Resources
- What is JAX?
- Elegy(High-level API for deep learning in JAX & Flax)
- Flax vs. TensorFlow
- JAX loss functions
- Optimizers in JAX and Flax
- Distributed training with JAX & Flax
- How to load datasets in JAX with TensorFlow
- Building convolutional neural networks with JAX and Flax
- LSTM in JAX & Flax
Follow us on LinkedIn, Twitter, GitHub, and subscribe to our blog, so you don't miss a new issue.